

Have you ever wondered how your teacher finds the average of the class marks? Or how do companies know which chocolate is the most sold? Mean median and mode:
Well, Here is the method they use for finding tabular numeric information.
Mean, median and mode are the measures of central tendency. These values define the data set.
Significantly, we use statistics in our daily life, even if we don’t directly use them! Therefore, here is the ultimate guide for mean, median, and mode!
- Distribution
- Measures of central tendency
- What is Mean?
- Understanding what median is?
- What is Mode?
- How to Calculate the Measures of Central Tendency
- Empirical relationship between mean, median, and mode
- Hints To remember the Difference
- Points to remember while solving
- How Mean, Median & Mode are Related?
- Frequently Asked Questions (FAQ)
- Conclusion
Distribution
A data set is a distribution of n number of scores or values.
Normal distribution
In a normal distribution, data is symmetrically distributed with no skew. Most values cluster around a central region, with values tapering off as they go further away from the centre. Also, The mean, mode and median are the same in a normal distribution. For Example Normal distribution. You survey a sample in your local community on the number of books they read in the last year.
Significantly, A histogram of your data shows the frequency of responses for each possible number of books. Lastly, From looking at the chart, you see that there is a normal distribution.
Skewed distributions
In skewed distributions, more values fall on one side of the centre than the other, and the mean, median and mode all differ from each other. Also, One side has a more spread out and longer tail with fewer scores at one end than the other. Also, The direction of this tail tells you the side of the skew
Therefore, in a positively skewed distribution, there’s a cluster of lower scores and a spread-out of the tail on the right. In a negatively skewed distribution, there’s a cluster of higher scores and a spread-out tail on the left.
Measures of central tendency
The three measures of central tendency are mean, median, and mode. These measures identify the typical values in a distribution. These values can represent the data as a whole.
What is Mean?
Mean can be commonly understood as the average of the data. To find it, add all the values, divide by the number of observations. The mean summarizes the entire data and gives you a typical value. For example: Have you ever thought, how your teacher finds out your CGPA? She finds the mean (average) of all your scores and then find the typical value.
Therefore, It is the most simple measure of central tendency. The formula for mean is with the help of the Greek letter “∑” known as Sigma, which means “sum of”
Understanding what median is?
Median is commonly known as the middle point of the data set. The data is arranged in ascending order (at times in descending order). Median is the most informative central tendency. Also, it is helpful to find out the distribution of skewed data. Also, the median divides the data into two halves. We have values less than the median and values greater than the median.
Above all, arranging the numbers in ascending order to get an accurate result is important. For Example, a Median can find the “middle” salary of the group of people.
What is Mode?
Mode is the most frequent number that repeats itself in the data set. This measure helps find the most “common” scores in a distribution. Mode is also known as the score or modal value. Significantly, the mode of distribution gives you a quick summary of the scores in the distribution. The mode is the same value as the mean and median.
For example: Do you know? How do companies find out about their most bought products? It is through mode.
How to Calculate the Measures of Central Tendency
The mean, median and mode are all ways of describing the central tendency of a set of data. They can be helpful in choosing what measure to use for measuring data sets with skewed distributions. This article covers how to calculate each of these measures, as well as some tips about how to go about solving.
Mean
Mean for ungrouped data
The formula for mean with ungrouped data is as follows-
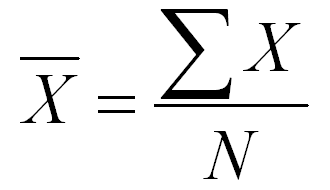
Where,
∑X= sum of all the number
N= number of observations
Let us solve this with an example-
| X |
| 2 |
| 2 |
| 4 |
| 6 |
| 6 |
Firstly, Add all the numbers to get a total.
Here, 2+2+2+4+6+6+= 20
Second Step: Find N, which is also known as the total number of values.
Here, N= 5, as there are 5 numbers in the data set.
Use the formula as given below, here ∑X= total of all the numbers, and N= number of data
Mean= 20/5
Last, Divide summation ∑X by /N, to get the ultimate answer.
Mean= 4
Mean for Ungrouped Data
| X |
| 12 |
| 14 |
| 16 |
| 18 |
| 20 |
| 22 |
| 24 |
X=125
Step 1-Add all the numbers to get a total.
Here, 12+14+16+18+20+22+24=125
Step 2– After this, find N, which is also known as the total number of values.
Here, N= 7, as there are 5 numbers in the data set.
Step 3– Then, Use the formula as given below, here ∑X= total of all the numbers, and N= number of data
Mean= 125/7
Step 4– Lastly, Divide summation ∑X by /N, to get the ultimate answer.
Mean= 17.85
The direct method for mean for grouped data
The formula for mean with grouped data is
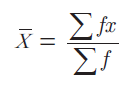
Where,
x= the mean value of the data set,
f= frequency of the individual data
fx= frequency of the data multiplied by x column
Let us find the mean with an example-
| x | f | fx |
| 1 | 4 | 4 |
| 2 | 2 | 4 |
| 3 | 4 | 12 |
| ∑f =10 | ∑fx= 20 |
Step 1– Add all the numbers in the f column, to find ∑f .
Here, ∑f =4+2+4= 10
Step 2– Multiply the frequency column (f) with the X column.
Here, 1×4= 4, 2×2=4 and 3×4= 12
Step 3– Then, Substitute the values into the formula.
20/10= 2
Therefore, the mean is 2.
Let us try another example
| X | F | Fx |
| 10 | 4 | 40 |
| 22 | 9 | 198 |
| 23 | 6 | 138 |
| 30 | 7 | 210 |
| 26 | 586 |
Step 1– Add all the numbers in the f column, to find ∑f .
Here, ∑f =4+9+6+7=26
Step 2– Multiply the frequency column (f) with the X column.
Here, 10×4= 40, 22×9=198, 23×6= 138 and 30×7= 210
Step 3– Substitute the values into the formula.
586/26
Therefore, the mean is 22.5.
Assumed mean method
The formula for the Assumed mean method is as follows-
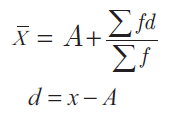
Where,
a= assumed mean
d= class mark – assumed mean
∑f= sum of all the frequencies
∑fd= sum of frequency (f) x d
Let us understand this with an example-
| Class (CI) | Frequency (f) | Class mark(xi) | d= xi- a | fd |
| 0-10 | 2 | 5 | -20 | -40 |
| 10-20 | 3 | 15 | -10 | -30 |
| 20-30 | 1 | 25= a | 0 | 0 |
| 30-40 | 3 | 35 | 10 | 30 |
| 40-50 | 1 | 45 | 20 | 20 |
| ∑f10 | ∑fidi= -20 |
Step 1– Find the class mark (xi) for each class. Here, the classmark is the central value of the class interval. It can be found by adding the upper limit and the lower limit of the class interval and dividing it by 2.
Upper limit+ lower limit / 2
For example- 0+10/2=5,
10+20/ 2= 30/2= 15 and so on.
Step 2– Find the assumed mean(a). The assumed mean is a ballpark average which is used to find out the mean. The assumed mean usually lies in the center of the class mark(xi) column. Here,25 is the assumed mean.
Therefore, a = 25.
Step 3– Then, Find the values for di. Here, di= the class mark of the corresponding class(xi)- assumed mean(a)
Example- 5-25= (-20), 10-25=(-15), and so on
Step 4– Multiply the frequency column with its corresponding “d” column
2 x -20= -40, 3 x -10= -30, and so on.
Step 5– Find the total for the fd column.
Here ∑fd= -20
Step 6– Then, substitute the values into the formula
a+ (fd/ f)
=25+ (-20/10)
= 25+ (-2)
=25-2= 23
Therefore, the mean is 23.
Let’s try solving another example
| CI | F | Xi | d=xi-a | fd |
| 150-160 | 2 | 155 | -30 | -60 |
| 160-170 | 6 | 165 | -20 | -120 |
| 170-180 | 15 | 175 | -10 | -150 |
| 180-190 | 20 | 185=a | 0 | 0 |
| 190-200 | 19 | 195 | 10 | 190 |
| 200-210 | 32 | 205 | 20 | 640 |
| 210-220 | 15 | 215 | 30 | 450 |
Step 1– Find the class mark (xi) for each class.
Upper limit+ lower limit / 2
For example- 150+160/2=155, and so on.
Step 2– Find the assumed mean(a).
Therefore, a = 185.
Step 3– Find the values for di.
Step 4– Multiply the frequency
column with its corresponding “d” column
Step 5– Find the total for the fd column.
Here ∑fd= 950
Step 6– substitute the values into the formula
a+ (fd/ f)
=185+ (950/115)
= 185+8.2
=193.2
Therefore, the mean is 191.6.
Step Deviation Method
The formula for the step deviation method is
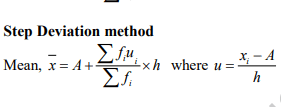
Where,
a= assumed mean
ui= (xi-a)/h
h= class size
∑fi= sum of all frequencies
∑fiui= sum of f x ui
Let us understand the same example used above
| Class (CI) | Frequency (fi) | Class mark(xi) | ui=(xi-a)/h | fiui |
| 0-10 | 2 | 5 | -2 | -4 |
| 10-20 | 3 | 15 | -1 | -3 |
| 20-30 | 1 | 25= a | 0 | 0 |
| 30-40 | 3 | 35 | 1 | 3 |
| 40-50 | 1 | 45 | 2 | 2 |
| ∑fi=10 | ∑fiui=2 |
Steps
Step 1– Find the class mark (xi) for each class. Here, the classmark is the central value of the class interval. It can be found by adding the upper limit and the lower limit of the class interval and dividing it by 2.
Example- (0+10)/2= 10/2= 5, (10+20)/2= 30/2=15, and so on
Step 2– Find the assumed mean(a). The assumed mean is a ballpark average which is used to find out the mean. The assumed mean usually lies in the center of the class mark(xi) column. Here, 25 is the assumed mean.
Therefore, a= 25.
Step 3– Find the ui values for each class interval.
ui can be found with the formula
ui= {class mark(xi)- assumed mean(a)} / height of the class interval(h)
example- for class interval 0-10
ui= (5- 25)/ 10
= -20/10= -2
Similarly, for class interval 10-20
ui= (15-25)/10
= -10/10= -1
Step 4– After finding the ui values for each class interval, find the values for fiui, which is the frequency of the class multiplied by the ui value of the corresponding class interval.
Step 5– Find the ∑fiui
Here, ∑fiui= -2
Step 6– Lastly, Substitute the values into the formula.
25+ 10 (-2/ 10)
= 25+ 10( -1/5)
= 25+ -2
=25-2= 23
Therefore, the mean according to standard deviation is 23, which is the same as the mean using the assumed mean method.
Median
Median for Ungrouped Data
The median is the middle number in a series of numbers. To find the median, arrange the data from least to greatest value. If there are an odd number of values, then find the arithmetic mean of the two middle values. If there are an even number of values, take the average of the two central values.
It is not possible to create a formula for the median, because the median value depends on the position of the middle value of the set and the fact that it is an even or odd set of numbers.
It can, however, be explained like this:
median (odd set of numbers) = ((n+1)/2)th term
median (even set of numbers) = ((n/2)th term + ((n/2)+1)th term)/2
For odd number of values-
The formula is given below-

Examples
Let us understand this with an example-
| 2 |
| 2 |
| 4 |
| 6 |
| 6 |
Step 1– Arrange all the numbers in ascending order.
Step 2-Check if there are odd number of values.
Here, since there are 5 values.
Step 3– Use the formula to find the value for the median.
(N+1/2)th position = 5+1 /2= (6/2)th position
= 3rd position.
In this sum, the third value is “4”.
Therefore the median is 4.
For Even number of values-
The formula is given below-
Let us understand this with an example-
Consider the data set-
| 4 |
| 5 |
| 6 |
| 7 |
| 8 |
| 9 |
Step 1– Arrange all the numbers in ascending order
Step 2-Check if there are an even number of values.
Step 3– Since there are even number of values in this sum, find the values for (N/2)th position and (N/2 +1)th position respectively.
(N/2)th position= (6/2)th position= 3rd position.
(N/2 + 1)th position= (6/2 + 1)th position= (3+1)th position= 4th position
Step 4– Substitute the values for N/2 and N/2 +1 in the formula
In this sum, the 3rd value is 6, and the 4th value is 7.
Step 5– Add the two values, and divide it by 2
Median= 6+7 /2= 13/2
= 7.5
Therefore the median is 7.5
Remember, the median is usually the middle value!
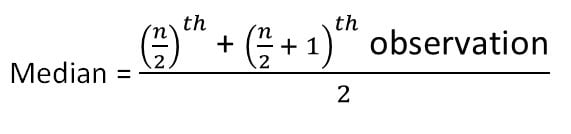
Median for Grouped data
To find the median for the grouped data, we use the formula
Where,
l= lower limit of the median class
n=total frequency
f= frequency of the median class
cf= cumulative frequency of the preceding class
h= height of the class
Let us understand this with an example
| Class Interval (CI) | Frequency(f) | Cumulative Frequency(cf) |
| 0-5 | 5 | 5 |
| 5-10 | 3 | 8 |
| 10-15 | 9 | 17 |
| 15-20 | 10 | 27 |
| 20-25 | 8 | 35 |
| 25-30 | 5 | 40 |
| N=40 |
Step 1– find the value of N, which is the sum of all the frequencies.
Here, N=40
Step 2– Find the value for N/2, to get the median class.
40/2= 20
When searching for the median class, make sure to check the cumulative frequency column to find the answer. The value of the number in the cumulative frequency column must be greater than the N/2 value.
Here, the N/2 value is 20. The value of the cumulative frequency in 15-20is 29. This means, that 25 lies between 14 and 29, and therefore you must pick the greater value.
Therefore, the median class is 15-20.
Step 3– after finding the median class, find the values to be put into the formula.
Lower limit of the median class (l)= 15
Cumulative frequency of preceding class(cf)= 17
Frequency of the median class(f)= 10
Height of the class (h)= 5
Step 4– Substitute the values into the formula.
Median= 15+ (20-17/10)x 5
= 15+ (3/10)x 5
= 15+ 0.3×5
=15+ 1.5
=16.5
Therefore, the median is 16.5
Let us try another sum
| CI | F | Cf |
| 150-160 | 8 | 8 |
| 160-170 | 6 | 14 |
| 170-180 | 15 | 29 |
| 180-190 | 20 | 49 |
| 190-200 | 19 | 68 |
| 200-210 | 32 | 100 |
| 210-220 | 15 | 115 |
Step 1– find the value of N, which is the sum of all the frequencies.
Here, N=115
Step 2– Find the value for N/2, to get the median class.
115/2= 57.5
57.5 lies between cf 49 and 68
Therefore, the median class is 190-200.
Step 3– after finding the median class, find the values to be put into the formula.
Lower limit of the median class (l)= 190
Cumulative frequency of preceding class(cf)= 49
Frequency of the median class(f)= 19
Height of the class (h)= 10
Step 4– Substitute the values into the formula.
Median= 190+ (57.5-49/19) x 10
= 190+ (8.5/19) x 10
=190+ (0.447)x 10
= 190 + 4.47= 194.47
Therefore, the median is 194.47.
Mode
Mode for ungrouped data
| 2 |
| 2 |
| 2 |
| 3 |
| 4 |
| 5 |
| 5 |
Step 1– search for the most common value in this data set.
Since the number 2 repeats more than the other numbers, the mode=2
Mode for grouped data
The formula for mode for grouped data is
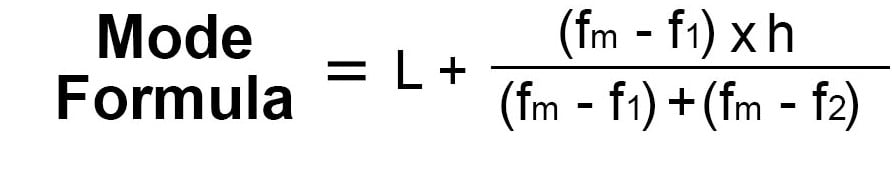
Where,
l= The lower limit of the modal class
h=Size of the class interval
fm= Frequency of the modal class
f1= Frequency of the class preceding the modal class
f2= Frequency of the class succeeding the modal class
Let us find the mode with this example-
| Class Interval(CI) | Frequency(f) |
| 0-10 | 5 |
| 10-20 | 4 |
| 20-30 | 3 |
| 30-40 | 6 |
| 40-50 | 2 |
| N=20 |
Step 1– Find the class with the maximum frequency.
Here, class 30-40 has a maximum frequency, and thus it is known as the modal class.
Step 2– Find the values for the formula
The lower limit of the modal class (L)= 30
Size of the class interval (h)= 10
Frequency of the modal class (fm)= 6
The frequency of the class preceding the modal class (f1)= 3
Frequency of the class succeeding the modal class (f2)= 2
Step 3– Then, Substitute the values into the formula as follows
Mode= 30 + 10 { (6-3) / (6-3) + (6-2) }
= 30 + 10 { 3/ (3+4) }
= 30+ 10 {3/7}
=30 + 10 {0.42}
=30+ 4.2
Mode= 34.2
Therefore, the mode = 34.2
Let us try solving another sum
| CI | F |
| 140-150 | 3 |
| 150-160 | 12 |
| 160-170 | 2 |
| 170-180 | 15 |
| 180-190 | 22 |
| 190-200 | 19 |
| 200-210 | 32 |
| 210-220 | 15 |
Step 1– Find the class with the maximum frequency.
Here, class 200-210 has a maximum frequency, and thus it is known as the modal class.
Step 2– Find the values for the formula
The lower limit of the modal class (L)= 200
Size of the class interval (h)= 10
Frequency of the modal class (fm)= 32
The frequency of the class preceding the modal class (f1)= 19
Frequency of the class succeeding the modal class (f2)= 15
Step 3– Then, Substitute the values into the formula as follows
Mode= 200 + 10 { (32-19) / (32-19) + (32-15) }
= 200 + 10 { 13/ (13+17) }
= 200+ 10 {13/30}
=200 + 10 {0.433}
=200+ 4.33
Mode= 204.33
Therefore, the mode = 204.3
Empirical relationship between mean, median, and mode
The empirical relation between mean, median, and mode can be written as-
Mode= 3Median- 2Mean
This can be understood through Karl Pearson’s formula, which states:
(Mean – Median) = 1/3 (Mean – Mode)
3 (Mean – Median) = (Mean – Mode)
3 Mean – 3 Median = Mean – Mode
3 Median = 3 Mean – Mean + Mode
3 Median = 2 Mean + Mode
In the case, where the frequency distribution has a symmetrical frequency curve, the empirical relation of the distribution is mean = median = mode.
In the case, where the frequency distribution is positively skewed, the empirical relation of the distribution is mean > median > mode.
In the case where the frequency distribution is negatively skewed, the empirical relation of the distribution is mean
Hints To remember the Difference
Having trouble remembering the difference between the mean, median and mode? Here’s a couple of hints that can help.
- “A la mode” is a French word that means fashionable ; It also refers to a popular way of serving ice cream. So “Mode” is the most popular or fashionable member of a set of numbers. The word MOde is also like MOst.
- The “Mean” requires you do arithmetic (adding all the numbers and dividing) so that’s the “mean” one.
- Also, “Median” has the same number of letters as “Middle”.
The Mean
Mean vs. Median
Mean vs. Average
Specific “Means” commonly used in Stats
Other Types
Mean Vs Median
Both are measures of where the center of a data set lies (called “Central Tendency” in stats), but they are usually different numbers. For example, take this list of numbers: 10, 10, 20, 40, 70.
- Firstly, The mean (informally, the “average“) is found by adding all of the numbers together and dividing by the number of items in the set: 10 + 10 + 20 + 40 + 70 / 5 = 30.
- Secondly, The median is found by ordering the set from lowest to highest and finding the exact middle. The median is just the middle number: 20.
Points to remember while solving

Firstly, Make sure to substitute the correct values in the formula. Write down the values on the side of the paper before substituting them into the formula.
You can cross-check if the values of the mean, median, and mode are accurate with the help of the empirical relation formula.
Draw a box around the median/modal class interval to make sure there are no slip-ups.
Make sure to remember all the formulae.
Also, There are websites to check for the correct answer. Make sure to cross-check answers for those, which the solution is not given.
How Mean, Median & Mode are Related?
How Are Mean, Median And Mode Related?
The 3 estimates of central tendency that is the mean, median and mode are related by the following empirical relationship.
2 Mean + Mode = 3 Median
For example, if it is required to compute the mean, median and mode of the data that is continuous grouped, then the values of the mean and median can be found using the above formulae. The value of the mode can be found using the empirical formula.
If the value of the mode is 65 and the median = 61.6, then find the value of the mean.
The value of the mean can be calculated using the formula,
2 Mean + Mode = 3 Median
2 Mean = (3 × 61.6) – 65
119.8 = 2 Mean
Mean = 119.8 / 2
Mean = 59.9
Frequently Asked Questions (FAQ)
- What is mean in statistics?
Answer- Mean is also known as the average of the data
2. What is the median in statistics?
Answer- Median is the central value of the data.
3. What is the mode in statistics?
Answer- Mode is the most frequently occurring value in the data set.
4. What is the empirical relationship between mean, median, and mode?
Answer- The empirical relationship between mean, median, and mode is
Mode= 3Median- 2Mean
5. What is the function of mean, median, and mode?
Answer-In short, mean, median, and mode are measures of central tendency that sum up the data set with a “typical value”. This value is used to represent the whole data set.
6. What are the three methods used to find the mean?
Answer- The three formulas used for the mean are – the direct method, assumed mean method, and step deviation method.
Fun ways to remember what each of the central tendencies means.
Median is the central value, so remember the word “middle”. Also, the middle and median have the same number of letters!
Mode is the number that occurs the most. Mode and most have the same number of letters as well.
For mean, you have to add and divide, which might not be fun for some people, (and can be mean at times).
Conclusion
Remember- Significantly, Mean is the average value of the data set, the median is the central value of the data set, and mode is the most frequent value that occurs in the data set.
Don’t forget to check out the worksheets on the Podium School website.
Share with your friends


